 Stock Trends Analytics empower you to accurately identify the direction, strength, and quality of medium- to long-term trends.
Capitalize on Stock Trends.
Overview: Working in conjunction with Trendrating SA, DIH offers Stock Trends Analytics so you can accurately identify the direction, strength, and quality of medium- to long-term trends around the world.
Our Stock Trends Analytics provide:
- A methodology that can sort out potential winners from losers.
- A unique rating for trends that offers an edge in identifying the majority of the 50% best-performing stocks to hold and 50% of the underperformers to avoid with a 12-month time horizon.
- A simple overlay of our robust rating and ranking of trends across your investment universe to help you get the most out of your carefully conceived investment strategy.
We can add a new intelligence layer to maximize returns and reduce performance risks.
Coverage: Stock Trends Analytics covers stocks, ETFs, indices, sectors, countries, commodities, and currencies across over 40 countries.
History: We have historical data going as far back as 2010.
Updates: We update our analytics daily.
Delivery: You can receive our data in bulk files via download, S3 to S3, or on-demand via API.
Pricing: Several inputs go into the pricing for our data. For example, do you want data for all available countries/markets and securities, or a subset? How much history do you want? Do you want updates going forward? Contact us to learn more.
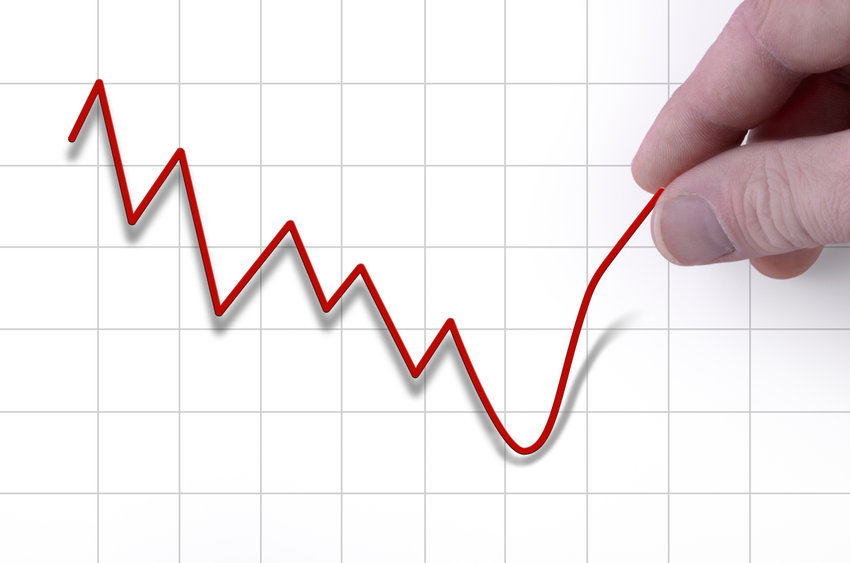
Trends Are Notoriously Hard to Capture – DIH Can Help.
Over 88% of all USA stock fund managers have underperformed the S&P Composite 1500 Index over the past 15 years.*
Why do active managers struggle so much? Several reasons…
- Traditional technical analysis is inconsistent across different cycles and market types.
- Momentum investing tends to be late due to fixed time windows that require time to adjust to fast-changing trends.
- Fundamentals alone fail because other factors influence stock trends.
- Price movement and fundamentals are increasingly out of sync.
All of these factors combined make portfolio management more complex and challenging. Delivering superior returns for active managers and stock selectors on a consistent basis requires the adoption of advanced analytics and state-of-the-art technology.
The ability to capture trends, profit from bull markets, and avoid bear phases is the key to superior performance on a consistent basis. Investors that have a good understanding and disciplined respect for stock trends outperform those that don’t.
Any investment strategy can be enhanced by a better synchronization to the development of stock trends.
Most investors use numerous metrics based on fundamental and quantitative data, but very few measure in a proven, objective and systematic way, the real direction of stock trends and remain hostage to market noise and opinions, despite the fact that capturing trends is the key to better returns.
* According to the S&P Indices Versus Active (SPIVA) Scorecard, through March 2020.
Capture Medium- to Long-Term Trends.
With Stock Trends Analytics you can evaluate the direction and the quality of medium- to long-term trends.
It is equally effective at identifying meaningful stock trends at the macro level, as well as screening from the bottom up to validate or generate new ideas.
Our analytics are complementary to other sources such as fundamental and quantitative data. Stock Trends Analytics provides an edge that can help to ride bull trends and avoid the damage associated to bear trends.
That’s why over 100 institutional investors around the world rely upon these analytics to improve their performance and control risks.
The key components of Stock Trends Analytics are:
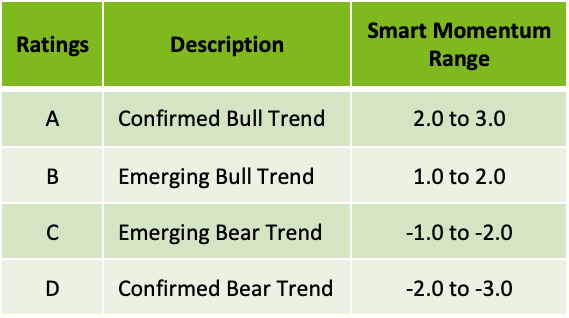
Ratings: The Rating indicates the directional trend of an instrument at any given date. A and B represent uptrends and C and D represent downtrends. A change in a Rating marks the identification of a stock trend that can last from a few months to a few quarters. Our mission is to capture medium- and long-term trends and not short-term price swings. So the model is designed to filter out short-term volatility and erratic price moves while focusing on the real underlying stock trend.
Smart Momentum Score: The Smart Momentum Score is the combination of the directional rating and stock trend magnitude into a single analytic. The score spans a range of -3.0 to +3.0 and allows you to differentiate between securities with the same Rating (A, B, C, or D). The Smart Momentum score is a powerful selection tool as it enables you to identify and rank securities within the same rating by their attractiveness. Stronger positive trends are preferred to positive weaker trends.
Retracement: Retracement is a Price Change Ratio that represents the performance from the best price from the rating day until today. The best price is the highest price from the rating day for A and B rated instruments and the lowest price for C and D. Retracement helps with the early detection of trends that are likely to change direction. This measure offers insight into securities whose trends are potentially exhausted and thus to avoid. Using Retracement as an outlier detector in the ranking module is a concrete way to manage risk. Outliers are securities that have the capacity to hurt portfolio performance.
THE MODEL BEHIND OUR STOCK TRENDS ANALYTICS
Stock Trends Analytics are generated by a proprietary model that was developed over five years by a team of veteran European data scientists at Trendrating SA. They tested 350+ indicators on 23 years of adjusted OHLCV daily data on 14,500 instruments across 52 countries.
A brute force method considered 8 billion candidate models. Importantly the model employs each security’s volatility and liquidity to construct the optimal time horizon over which it observes the underlying descriptors for early stock trend detection.
The final result is a proven method to consistently identify and measure meaningful trends that work in any type of market cycle.
Who Can Benefit from Stock Trends Analytics?
Given how important trends are to investing, a wide variety of firms rely upon Stock Trends Analytics, including:
- Asset managers
- Wealth managers
- Fund managers
- Risk managers
- Advisors
- Value investors
- Systematic investors
Such firms utilize Stock Trends Analytics in various ways, especially in their research and risk management departments.
Various Ways to Utilize Stock Trends Analytics.
Depending on your focus, there is a myriad of ways to use Stock Trends Analytics:
- Analyze, compare and validate holdings & investment ideas.
- Identify new investment opportunities across markets and sectors.
- Tactically select & allocate across markets, regions, and sectors so you are not out of sync with prevailing trends.
- Improve your risk models and fine-tune exposure to individual holdings & portfolios by spotting in time underperformers.
- Be alerted to stock trend reversals.
Flexible Updates & Delivery Methods for Stock Trends Analytics.
Our Stock Trends Analytics are updated on a daily basis.
You may customize our Stock Trends Analytics to best suit your needs. For example, specify the securities, exchanges, or countries from which you’d like to receive Trend Capture Analytics.
We offer several ways to access our Stock Trends Analytics:
Bulk File Download – For most of our clients, downloading our Stock Trends Analytics in bulk files is most convenient. We can deliver files in various formats (e.g. CSV) via download, S3 to S3 transfer, etc.
API – Some use cases are better suited for on-demand delivery of specific data points via an API.