
DIH’s FX Option Volatility Surfaces.
Overview: DIH provides daily volatility surfaces with skew for precious metals and FX options. Results are expressed for at-the-money (ATM) strikes as percentage implied volatility, and as offsets to the corresponding ATM volatility for 10 and 25 delta risk reversals and butterflies.
Coverage: We currently cover gold, silver, and 30 global currencies.
History: Our data includes up to 5 years of history.
Updates: We update our FX option volatility surfaces both intraday and at the end of the day.
Delivery: You can receive our data in bulk files via SFTP.
Pricing: Several inputs go into the pricing for our data. For example, do want data for all available instruments, or a subset? How much history do you want? Do you want updates going forward? Contact us to learn more.
Why Firms Choose DIH’s Data.
Institutional market participants use DIH’s FX option volatility surfaces for valuations, portfolio analytics, and risk management calculations.
There are several reasons institutional investors rely upon our data:
- Market Coverage – We currently provide daily volatility surfaces for gold, silver, and over 30 currencies.
- Accuracy – Our data is created from market-observable quotes for precious metal and FX options directly from dealer desks. These quotes are checked for spurious outliers or stale contributions. Then they are averaged into a composite.
- Cost – There are not a lot of sources for FX option volatility surfaces, and so the legacy data providers are typically inflexible when it comes to what they charge for such data. In contrast, DIH works with its clients to provide data within their budget.
An Overview of FX Option Volatility Surfaces.
Before we get into the details of how our data is created, a quick review of volatility surfaces may be helpful.
First, we should define some terms…
HISTORICAL VOLATILITY.
This metric measures how much a security’s price has deviated from its average over a period of time. It is sometimes referred to as “realized volatility” or “statistical volatility”.
IMPLIED VOLATILITY.
This is a mathematical formula that forecasts the likely movement of a security’s price in the future. Implied volatility is used to price options contracts, where high implied volatility results in options with higher premiums, and vice versa. Implied volatility approximates the future value of the option, and is commonly expressed using percentages and standard deviations over a specified time horizon.
Supply and demand of the underlying security are major determining factors for implied volatility. For example, when a security is in high demand, the price tends to rise. So does the implied volatility, which leads to a higher option premium due to the risky nature of the option.
Another important determiner of implied volatility is the time value of the option (i.e. the amount of time until the option expires). An option that is close to expiring often results in low implied volatility, and an option with longer until its expiration tends to result in high implied volatility.
VOLATILITY SURFACE.
The volatility surface is a three-dimensional plot showing the implied volatilities of options across different strike prices and expirations. The X-axis is the time to maturity, the Z-axis is the strike price, and the Y-axis is the implied volatility. Because the assumptions that investors make when pricing options are not always accurate, the volatility surface varies over time and is far from flat. Also, put and call options usually have different volatility surfaces.
VOLATILITY SKEW.
Not all options on an underlying security have the same implied volatility. This is because of discrepancies in how investors price options with different characteristics and the pricing models being used. As you move up or down the strike price from the at-the-money strike, implied volatility can be either increasing or decreasing with time to maturity.
For example, downside put options have higher implied volatilities in the market than their models would otherwise predict. This is because investors and traders who are naturally long will buy protective puts for insurance purposes. This bids up the prices of the puts relative to upside options. This is known as the “volatility skew”, or “vertical skew”.
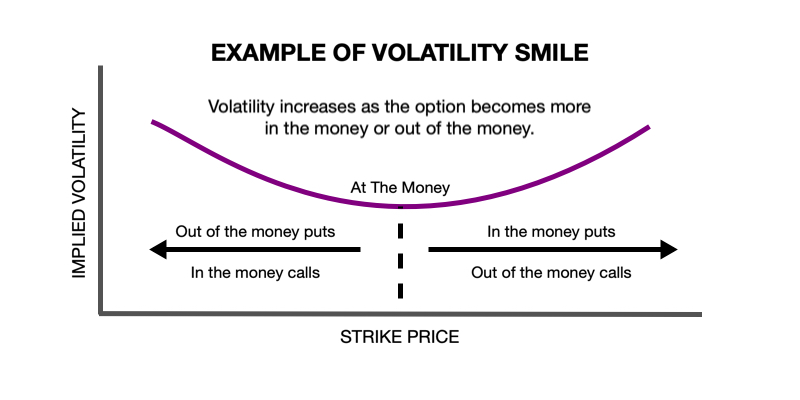
If upside options are also bid, often due to expectations of a potential takeover, then a “volatility smile” occurs as both extremes have increased implied volatilities. That is, at-the-money options have lower implied volatility than out-of-the-money or in-the-money options. Or another way to think of a volatility smile is that the implied volatility for both puts and calls increases as the strike price moves away from the current underlying security price.
It is called a “smile” because of the shape the data creates when plotting implied volatilities against strike prices on a chart.
If the curve is weighted to one side, it is referred to as a “volatility smirk”.
The volatility surface can also have an “inverted volatility smile”. This happens because options with a shorter time to maturity have dramatically more volatility compared to options with longer maturities. An inverted volatility smile can appear even more pronounced in periods of high market stress.
If implied volatility is higher on options with lower strike prices, it is called a “reverse skew”. This is most commonly seen in index options or other longer-term options. It appears to be caused when investors have market concerns and buy puts to compensate for the perceived risks.
Conversely, if implied volatility increases on options with higher strike prices, it is called a “forward skew”. Forward skews usually occur in the commodities markets (especially agricultural items and oil) when an imbalance occurs in supply and demand that has an immediate impact on price.
LOCAL VOLATILITY.
Rather than look at the entire volatility surface, local volatility considers the implied volatility of just a small area of the overall volatility surface. It may focus on just a single option, either a call or a put of a specific strike price and expiration. The volatility surface is the aggregation of all the local volatilities in an options chain.
VOLATILITY TERM STRUCTURE.
This is part of the volatility surface that describes how options on the same underlying security will exhibit different implied volatilities across different expiration months, even for the same strike. The volatility term structure can be either upward or downward sloping depending on market conditions and expectations. An upward slope indicates that the market expects the underlying security to become more volatile over time; and a downward slope that it will become less volatile.
RISK REVERSAL.
A risk reversal in forex trading refers to the difference between the implied volatility of out-of-the-money (OTM) calls and OTM puts. A positive risk reversal means the volatility of calls is greater than the volatility of similar puts, which implies more market participants are betting on a rise in the currency than on a drop, and vice versa if the risk reversal is negative.
For example, for a given expiration date, you can determine the “25 risk reversal” which is the volatility of the call with a delta of 25% less the volatility of the put with a delta of -25%.
Delta estimates how much an option’s value may change given a $1 change in the underlying security. The Delta values range from -1 to +1, with 0 representing an option whose premium barely moves relative to price changes in the underlying security.
METHODOLOGY BEHIND OUR FX OPTION VOLATILITY SURFACES.
The data starts with market-observable quotes for precious metal and FX options directly from dealer desks. These quotes are checked for spurious outliers or stale contributions. Then they are averaged into a composite.
The resulting data files include the following:
Proprietary Identifiers – made up of the:
- Currency – the ISO currency code or precious metal referenced by the option, relative to USD.
- Delta – the delta of the quote, either 10 or 25. For at-the-money options, this field contains a zero.
- Quote Type – denotes either a Butterfly (BF), Risk Reversal (RR), or at-the-money (AM) quote.
- Option Tenor – the tenor of the option, expressed as overnight (ON), spot week (SW), and standard expiries in months (M) or years (Y).
Spotted Date – the date on which the BID or ASK was spotted in the market. Volatilities are spotted as of the close of the local currency bond market (historical files only).
Bid – the bid FX option implied volatility (for ATM options) expressed as a percentage or the offset to the ATM volatility (for 10 and 25 delta risk reversals and butterflies).
Ask – the ask FX option implied volatility (for ATM options) expressed as a percentage or the offset to the ATM volatility (for 10 and 25 delta risk reversals and butterflies).
Who Can Benefit from DIH’s FX Option Volatility Surfaces?
FX option volatility surfaces are invaluable to anyone who participates in the over-the-counter forex market or the forex derivatives markets. We see a wide range of institutional market participants using our data, including:
- Hedge Funds
- Asset Managers
- Proprietary Trading Firms
- Investment Banks
Such firms utilize our volatility surfaces in various ways, especially in their research and risk management.
How Firms Use Our FX Option Volatility Surfaces.
Institutional market participants rely upon our FX option volatility surfaces for:
- Valuations
- Portfolio Analytics
- Risk Management
Often they use our FX option volatility surfaces to price options and exotic structured notes.
Flexible Updates & Data Delivery Methods.
Our FX option volatility surfaces data is available on an intraday or end-of-day basis.
You may customize our data to best suit your needs. For example, request data on all available instruments or provide a custom list.
We offer several ways to access our FX option volatility surfaces data:
Bulk File Download – For most of our clients, downloading our data in bulk files is most convenient. We deliver files in .CSV format via SFTP.